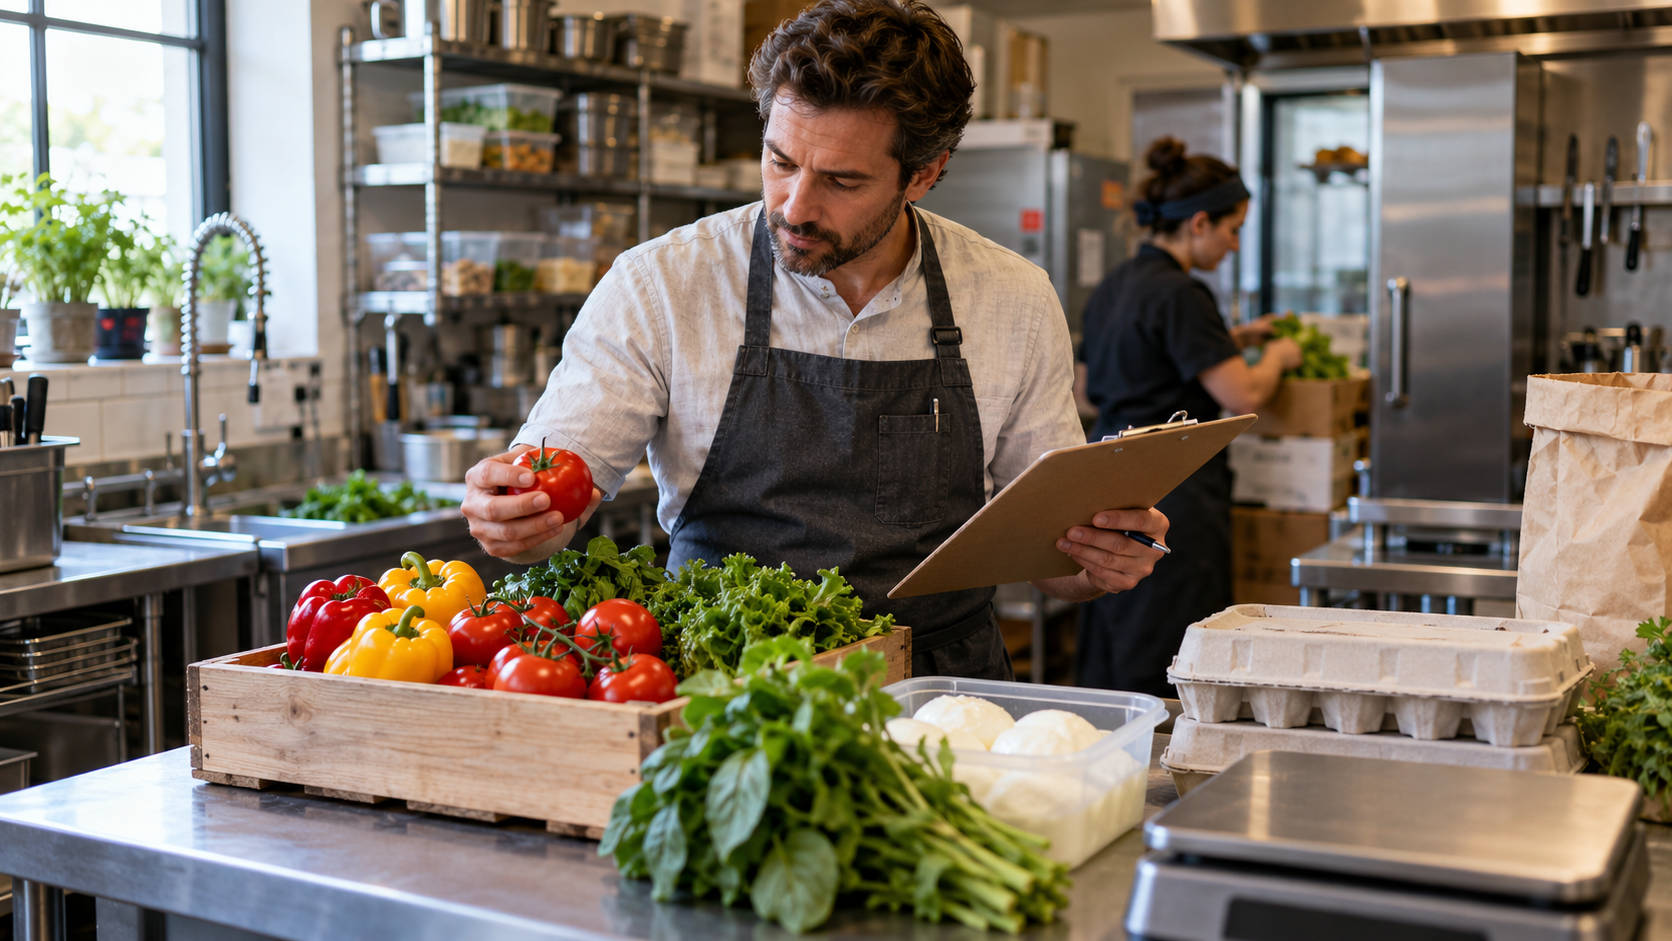
U.S. wholesale food prices were 2.6% lower in September 2026 than a year earlier. Yet producer prices for prepared seafood rose 19.3% and fresh vegetables 17.8%, according to the National Restaurant Association’s analysis of Bureau of Labor Statistics data.
So are restaurant food costs falling in 2026? Slightly, on average. But ingredients are moving in opposite directions. Eggs, butter, and pork fell sharply, while seafood, produce, cooking oils, and flour rose. Whether you feel relief depends on what you buy, from whom, and on what terms. Your own invoices, not a national average, should drive your menu and purchasing decisions.
- Are restaurant food costs actually falling in 2026?
- Which restaurant ingredient prices are rising, and which are falling?
- Why can your supplier invoices stay high when national food prices fall?
- How can you find out which price changes affect your menu?
- How much can one ingredient price increase change a menu item’s margin?
- When should a restaurant change its menu prices?
- Can falling ingredient prices create new menu opportunities?
- How can restaurant owners keep menu pricing aligned as costs change?
- Don’t reprice your restaurant based on a headline
- FAQ
Are restaurant food costs actually falling in 2026?
Wholesale food prices are lower than a year ago, but not across the board, and still far above pre-pandemic levels.
The Producer Price Index for all foods rose 0.6% from August to September 2026, yet sat 2.6% below September 2025 and 34% above February 2020. The 2026 restaurant food cost trend is a modest pullback from a high base, not a reset.
Three prices often get blurred together:
- Producer prices are what farmers and processors receive. The national index tracks these.
- Supplier prices are what you pay your distributor, including processing, freight, and contract terms. No national index measures your invoice.
- Menu prices are what guests pay. The USDA Economic Research Service reports food-away-from-home prices up 3.5% year over year in September, with a 3.5% rise forecast for 2026.
A falling producer index is a signal, not a refund. USDA notes that producer prices swing far more than consumer prices, and the swings shrink as food moves toward retail.
Which restaurant ingredient prices are rising, and which are falling?
Seafood, fresh produce, fats and oils, and wheat flour rose the most over the past year. Eggs, butter, pork, and cheese fell.
| Food category | Producer price change, Sept. 2025 to Sept. 2026 | Menus most exposed |
| Prepared seafood | +19.3% | Seafood, poke, sushi |
| Fresh vegetables | +17.8% | Salads, bowls, Mexican, Thai |
| Fats and oils | +14.8% | Fried chicken, fries, wings |
| Wheat flour | +9.4% | Pizza, bakery, sandwiches, pasta |
| Fresh fruit | +9.1% | Smoothies, breakfast, desserts |
| Cheese | -4.5% | Pizza, sandwiches, Mexican |
| Pork | -19.4% | BBQ, breakfast, many Asian menus |
| Butter | -32.0% | Bakeries, breakfast cafes |
| Eggs | -75.3% | Breakfast, brunch, bakeries |
Your exposure depends on your purchasing mix. A seafood restaurant sits almost entirely on the rising side. A breakfast cafe may see the most relief. A pizzeria lands on both: flour and fryer oil up, cheese down. The NRA reaches the same conclusion.
Treat these figures as direction, not a number to apply to your invoice. USDA puts farm-level egg prices 75.3% below a year earlier, but retail egg prices fell only 20.6%, because grading, packing, and distribution costs did not fall with the egg.
Keep monthly and yearly changes apart, too. Fresh vegetables jumped 36.9% from August to September alone, a separate figure from the 17.8% annual change.
Why can your supplier invoices stay high when national food prices fall?
Your invoice reflects your products, supplier, and terms. The index averages producer prices. The gaps between them include:
- Timing. Distributors reprice on their own schedules, and changes take time to pass down the supply chain.
- Contracts. Fixed-price, cost-plus, and market-based terms respond at different speeds.
- Specification. Wild-caught or premium-grade products may not track the category average.
- Processing. Pre-cut or portioned products carry labor and packaging costs that do not fall with the raw commodity.
- Freight and order size. Delivery costs, regional supply, and split cases raise per-unit costs.
- Substitutions. An out-of-stock item may arrive as a different brand or pack.
None of this proves a supplier is withholding savings. Check your own numbers first. If your invoices check out but your food cost percentage still looks wrong, see why restaurant food cost numbers don’t match.
How can you find out which price changes affect your menu?
Run a 30-minute ingredient-cost audit on five ingredients. You need recent invoices, your POS item sales report, and a calculator or spreadsheet.
- Pick five ingredients (5 min). Choose your biggest dollar purchases, plus anything from a category above that moved sharply.
- Pull matching invoices (5 min). Compare the current invoice with one from about three months ago, same product and pack size.
- Standardize units (5 min). Convert to cost per pound, ounce, or each, then divide by usable yield. An $11.00 pound of fillet at 90% yield costs $12.22 per usable pound.
- Calculate the change (2 min). New cost minus old cost, divided by old cost.
- Find affected menu items (5 min). Your POS item sales report shows which best sellers use each ingredient.
- Estimate the per-portion change (5 min). Multiply the change per usable ounce by the ounces in each portion.
- Rank by monthly impact (3 min). Multiply the per-portion change by monthly units sold. Act on the largest dollar figures, not the largest percentages.
A hypothetical result:
| Ingredient | Previous unit cost | Current unit cost | Change | Affected menu item | Action |
| Salmon fillet, per lb | $11.00 | $12.65 | +15.0% | Salmon bowl | Portion math, second quote |
| Romaine, 24-ct case | $38.00 | $44.50 | +17.1% | Caesar, wraps | Check spec, seasonal swap |
| Fryer oil, 35-lb jug | $42.00 | $46.20 | +10.0% | Fries, wings | Review oil life |
| Mozzarella, per lb | $3.60 | $3.45 | -4.2% | Pizzas | Monitor |
| Eggs, 15-dozen case | $54.00 | $38.00 | -29.6% | Breakfast plates | Confirm next invoice |
This egg invoice fell about 30%, not 75%. That is the gap between an index and a real purchase.
How much can one ingredient price increase change a menu item’s margin?
Enough to affect restaurant menu profitability on a best seller. In this hypothetical, a 15% salmon increase cuts a $16.00 bowl’s contribution after food cost by $0.57, about 5%. The bowl uses 5 ounces of usable salmon at 90% yield, plus $1.60 of rice, vegetables, and sauce.
| Before | After | |
| Salmon invoice, per lb | $11.00 | $12.65 |
| Cost per usable lb (90% yield) | $12.22 | $14.06 |
| Salmon per 5-oz portion | $3.82 | $4.39 |
| Rice, vegetables, sauce | $1.60 | $1.60 |
| Total recipe cost | $5.42 | $5.99 |
| Food cost percentage | 33.9% | 37.4% |
| Contribution after food cost | $10.58 | $10.01 |
At 300 bowls a month, that is $171 less contribution.
Yield matters as much as price. If the new fillets trim to 85% usable, the portion costs $4.65 and the bowl loses $0.83.
Reprice carefully, too. Restoring the old 33.9% food cost percentage would take a $17.68 price, a $1.68 increase for a $0.57 cost change. A $16.57 price protects the dollar contribution instead.
Contribution after food cost is not profit. Packaging, card fees, marketplace commissions, labor, and rent still come out of the $10.01, so the full $0.57 reduces what remains.
When should a restaurant change its menu prices?
Change a price when an increase is sustained, meaningful on a high-volume item, and not fixable another way. To reduce restaurant food costs without touching prices, start with purchasing, portions, and recipes.
- Monitor a one-invoice increase or a volatile item like produce. Wait for the next invoice.
- Absorb small per-portion changes on low-volume items.
- Negotiate or get a competing quote when your invoice rose faster than its category, or did not fall where its category did.
- Tighten portions when usage runs above the recipe. That fixes cost without changing what guests were promised.
- Adjust the recipe with a seasonal or lower-cost side or garnish before you touch the main ingredient.
- Raise the price when the increase holds for two or more invoices on a top seller and other levers are used up.
Weigh guest expectations. NRA data shows menu prices up 3.5% year over year in September 2026, versus 1.8% for groceries. A targeted increase on the affected item asks less of guests than an across-the-board one. Our menu engineering guide helps you judge which items can carry it, and how to build a restaurant menu covers the other costs a price must cover.
Can falling ingredient prices create new menu opportunities?
Yes, if the savings appear on your invoice and the math works after any discount.
Producer prices fell for eggs, butter, pork, and cheese. Confirmed savings can lift contribution on a dish at its current price, fix a popular but thin-margin item, or support a special or value bundle.
Run the numbers first. Say a cafe’s egg invoice drops from $54 to $38 per 15-dozen case, or $0.30 to $0.21 per egg. A three-egg omelet now costs $0.27 less. Holding the price adds $0.27 of contribution per plate. A $1-off promotion costs $0.73 more than those savings on every plate you already sell, so it only works if it brings in enough new orders.
USDA notes that avian influenza has driven sharp egg price swings in recent years, so treat this relief as temporary until several invoices confirm it. To test a special, use the 14-day check in our guide to fall menu specials profitability.
How can restaurant owners keep menu pricing aligned as costs change?
Pair invoice checks with sales data, then update prices once across every channel.
Orders.co reporting shows sales by channel and your top-performing items across your restaurant POS, website, and connected delivery apps, which speeds up step 5 of the audit. When a price changes, menu management updates items, prices, and availability once across your POS, website, and connected marketplaces, with separate marketplace pricing if you need it. Marketplaces may display updates on different timelines, so spot-check your listings.
Ingredient costing still lives in your invoices and recipe sheet, and reports are only as accurate as the data behind them.
Don’t reprice your restaurant based on a headline
National food price data gives you context. Your invoices, recipes, portions, and sales mix give you the answer.
This week, pull the last two invoices for your top five ingredients and run the 30-minute audit. Then act on the two or three items with the largest monthly dollar impact.
If keeping prices consistent across channels is the hard part, see how Orders.co connects menu and sales management.
About the data
Producer prices: NRA analysis (October 15, 2026) of preliminary Bureau of Labor Statistics data for September 2026. Consumer prices and forecasts: USDA ERS Food Price Outlook (October 23, 2026) and NRA menu price analysis (October 14, 2026). Producer prices measure what producers receive, not what restaurants pay distributors, and preliminary data can be revised. Invoice and recipe figures are hypothetical.
FAQ
How often should a small restaurant compare supplier prices?
Check your top five ingredients monthly and volatile items like seafood and produce on every delivery. A few times a year, get a competing quote on your largest purchases for the same spec and pack size.
How should restaurants handle price changes on contracted ingredients?
Check the pricing terms. Fixed-price agreements can shield you from increases but delay decreases. Cost-plus and market-based terms tend to follow the distributor’s costs. Note when prices reset and what they are tied to, and review the terms before renewal.